


When apps slow down or stop working, it affects productivity and frustrates users. That’s where Application Performance Monitoring (APM) steps in. It’s a valuable approach to maintaining a high-performing digital workplace by keeping a close eye on how applications behave.
What is Application Performance Monitoring (APM)
Application Performance Monitoring, or APM, is the process of tracking how well software applications perform. It helps organisations identify issues like slow response times, errors or downtime. By doing this, APM supports smooth operation and ensures that digital tools meet both technical expectations and wider business needs.
Rather than waiting for users to report a problem, APM tools work behind the scenes to monitor key metrics. They offer visibility into application health, so IT and development teams can step in before users are affected.
What does APM do?
The main job of APM is to keep everything running as expected. It monitors things like how quickly pages load, how often errors occur, and how much strain the system is under at any given moment. When something doesn’t look right, it flags it early.
Beyond that, APM helps teams understand why a problem has happened. With access to detailed performance data, they can trace issues back to their root causes and make improvements.
APM also helps improve collaboration. When everyone, from IT to developers and business teams, can access the same insights, it becomes easier to prioritise fixes, reduce confusion, and improve the overall user experience.
How application performance monitoring works
APM tools follow a clear process. First, they gather data from across the system, using logs, metrics and even simulated user activity. This information helps build a picture of how the application is performing in real time.
The tool analyses this data to identify patterns and detect anything out of the ordinary. If something crosses a certain threshold, it triggers an alert. This gives teams a heads-up before the issue impacts users.
The final step involves using these insights to make things better. Whether that means improving code, reconfiguring infrastructure or fine-tuning the user interface, APM provides the evidence needed to take meaningful action.
Key features of APM tools
Different APM platforms offer various features, but here are some of the most common and useful ones:
-
Distributed tracing – tracks requests across different systems and services
-
Real user monitoring (RUM) – shows what real users experience
-
Synthetic monitoring – simulates user journeys to find potential issues
-
Code-level diagnostics – identifies errors in code
-
Service dependency mapping – helps teams see how systems interact
-
Custom KPIs and SLO tracking – aligns performance with business goals
-
AI-powered anomaly detection – flags unusual behaviour automatically
Examples of application performance monitoring in action
Here are some real-world examples to show how APM works:
-
Monitoring an e-commerce checkout slowdown
-
Checking Microsoft 365 performance
-
Troubleshooting remote SaaS issues
-
Diagnosing HR system crashes
-
Tracking mobile or cloud-native apps
Popular application performance monitoring tools
Several well-known tools help organisations monitor application performance. These include Dynatrace, New Relic, Datadog, AppDynamics and Splunk. OpenTelemetry also plays an important role as a standard for collecting and sharing performance data.
Each of these tools provides detailed visibility into how applications behave. But they often work best when combined with a platform that brings everything together. That’s where Workspace 365 adds value, by simplifying access and offering early visibility into the tools that matter most.
How Workspace 365 enhances application performance
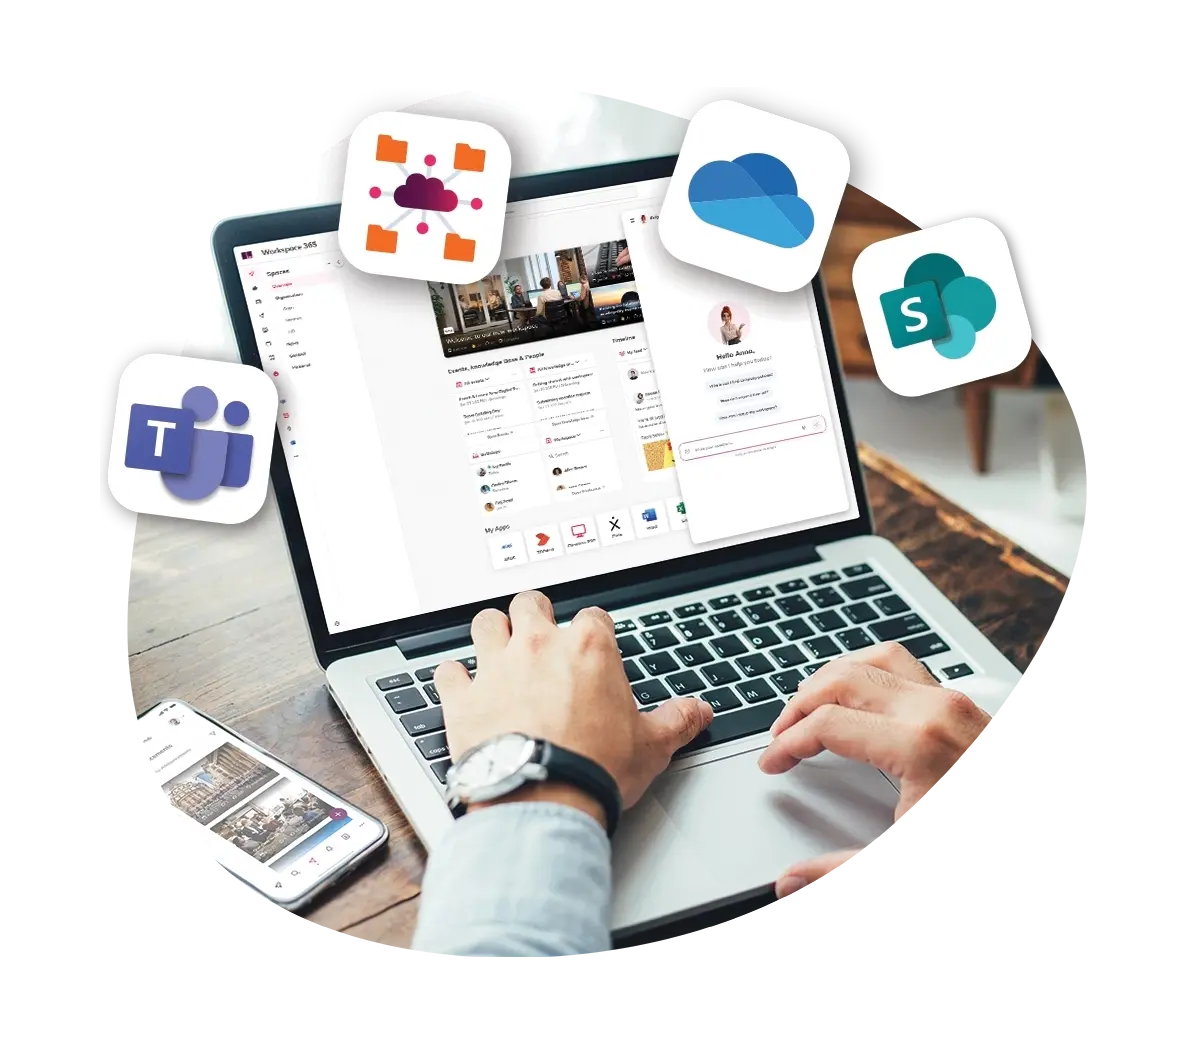
While Workspace 365 doesn’t monitor or manage application performance, we make it easier for people to access the tools they rely on, safely and efficiently.
By bringing all applications into one digital workplace, we reduce the friction that often comes with switching between platforms. Whether it’s Microsoft 365, a legacy system or a SaaS tool, people know where to find what they need, without logging in separately or navigating through different interfaces.
Access is personalised and secure. IT teams can set conditions based on location, device or network, ensuring users only see what’s relevant to them. This helps protect sensitive information, while giving people a faster way to reach the apps and data they use every day.
Frequently asked questions about Application Performance Monitoring
How does APM differ from basic logging or network monitoring?
Logging records events and errors, while network monitoring focuses on traffic and connectivity. APM looks at end‑to‑end application behaviour, combining metrics, traces and user experience data to pinpoint where and why performance issues occur.
What are the business benefits of using APM?
Beyond fixing technical glitches, APM improves user satisfaction, reduces downtime and helps teams prioritise development work. It also provides insights that support decisions about scaling infrastructure and optimising costs.
Can APM tools monitor cloud‑native and microservices architectures?
Modern APM platforms are designed to trace requests across distributed environments, including containerised microservices, serverless functions and hybrid clouds. Features such as distributed tracing and service dependency mapping make it possible to see how each component impacts overall performance.
How do I choose the right APM solution?
Consider the types of applications you run (web, mobile, legacy), the level of detail you need (code-level diagnostics vs. high-level metrics), and how the tool integrates with your existing stack. Look for solutions that support open standards like OpenTelemetry so you can avoid vendor lock‑in.
What is the role of OpenTelemetry in APM?
OpenTelemetry is an open standard for generating and exporting telemetry data (traces, metrics and logs). Many APM vendors support it as a common language, which makes it easier to collect data from diverse systems and use it with the monitoring tool of your choice.
Does Workspace 365 replace APM tools?
Workspace 365 doesn’t perform performance monitoring itself. Instead, it complements APM by giving users a single, secure entry point to all their applications. This helps reduce context switching and ensures that people can quickly access the tools whose performance is being monitored.